

Almost everything written about bounce rate before 2023 describes a metric Google retired. The definition changed, the benchmarks changed, and Google now hides the number by default. Here is what it actually measures today.
If you have been comparing your bounce rate to a benchmark you read somewhere, there is a good chance you are comparing 2 different metrics that share a name.

The Bounce Rate You Learned Does Not Exist
In the old Universal Analytics, a bounce was simple: someone landed on a page and left without visiting a second page. That was it. Time on page did not matter.
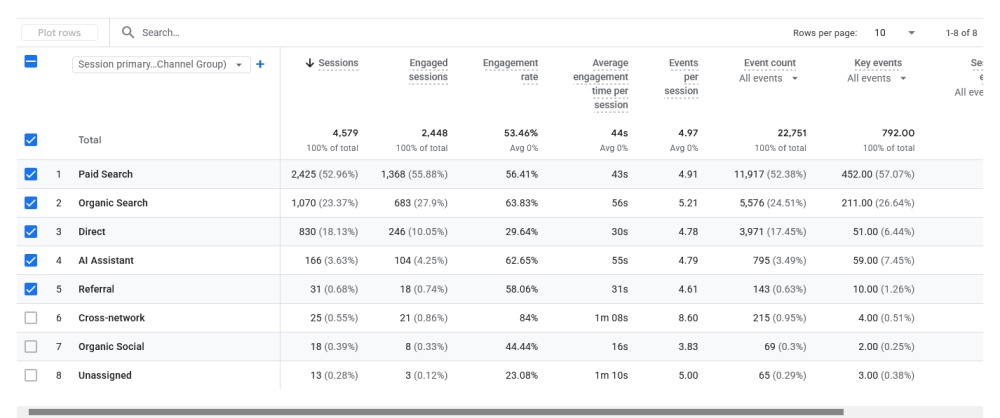
GA4 threw that out. A session now counts as engaged if it meets any 1 of 3 conditions, and a bounce is any session that meets none of them.
The consequence is that the same visit can be a bounce in one system and a success in the other. Someone reads a 2,000 word article for 4 minutes, gets exactly what they came for, and closes the tab. Under the old definition that was a bounce. Under GA4 it is an engaged session, because it lasted longer than 10 seconds.
What Counts as a Bounce in GA4

A session is engaged if any of these is true:
- It lasts longer than 10 seconds of foreground engagement time
- It includes at least 1 key event, which is what GA4 now calls a conversion
- It includes 2 or more page or screen views
A bounce is a session where none of those happened. Under 10 seconds, no key event, and only 1 page.
The 10 second threshold is the only part you can change. In GA4, go to Admin, then Data Streams, then Configure tag settings, then Adjust session timeout. You can set it anywhere from 10 to 60 seconds. Most sites should leave it alone. Content-heavy sites sometimes raise it to 20 or 30 seconds so that a genuine read is required before a session counts as engaged.
One consequence worth knowing: if your conversion tracking is broken, your bounce rate is wrong. Key events are 1 of the 3 engagement triggers, so a site that never fires a form submission event reports more bounces than it actually has.
Why Old Benchmarks Are Useless Now
Every benchmark table published before 2023 is based on the single-page definition. Those numbers cannot be compared to a GA4 figure, and articles that mix the 2 are giving you a target that does not exist.
The size of the gap matters. A site that reported roughly 62% bounce under the old definition typically reports around 52% under GA4, without a single thing changing on the site. If you migrated and celebrated an improvement, that was the metric changing, not your website.
So if you still have historical Universal Analytics data, do not draw a trend line through the migration date. Treat it as 2 separate charts.
What Is a Normal Bounce Rate in 2026
Measured properly under the GA4 definition:
- Cross-industry median: around 47.4% bounce, which is 52.6% engagement rate
- Top quartile: around 36.1% bounce
- Desktop: around 39.7%
- Mobile: around 51.8%
The median is not a target. It means half the web is worse than that. If you want a number to aim at, the top quartile at roughly 36% is the honest benchmark.
And a blended site-wide number is close to useless on its own. A blog post and a pricing page should not be judged against the same figure.
Why Mobile Bounces 12 Points Higher

Mobile sessions bounce at roughly 51.8% against 39.7% on desktop, a gap of about 12 points that has not closed in 3 years despite the industry’s move to mobile-first design.
That is not entirely a design failure. Mobile carries a different mix of intent. People browse on a commute, tap links from social feeds out of curiosity, and open push notifications, none of which are strong intent. Connection quality varies more too.
The practical takeaway is to stop comparing your mobile number to your desktop number and start comparing your mobile number to your own mobile number last quarter. If the gap on your site is much wider than 12 points, that part probably is a design problem, and speed is the usual culprit. Our list of website speed test tools is the fastest way to check.
Where to Find It, Because Google Hid It
GA4 does not show bounce rate by default. Google wants you looking at engagement rate instead, so bounce rate is a non-standard column you have to add.
To see it in a standard report, open Reports, then Engagement, then Pages and screens, click the pencil icon to customise the report, open Metrics, and add Bounce rate to the list. Save the changes.
To analyse it properly, build an Exploration instead. Add Landing page as the dimension and Sessions, Engagement rate and Bounce rate as metrics. That gives you the per-page view that actually tells you something, rather than one blended site-wide number.
Honestly, most teams are better off working with engagement rate and ignoring bounce rate entirely. It is the same information pointed in a more useful direction, where higher is better and nobody has to invert it mentally in a dashboard.
Is Bounce Rate a Google Ranking Factor

No. Google has stated repeatedly that it does not use Google Analytics data in ranking, and bounce rate is a Google Analytics metric, not something Google measures about your site independently.
What is true is that the things which cause a high bounce rate, a slow page, content that does not match the search, a layout nobody can use on a phone, are the same things that hurt rankings through other mechanisms. So the correlation is real while the causation is not.
Treat bounce rate as a diagnostic, not a target. It tells you where to look. It does not tell Google anything. If your real problem is that pages are not ranking at all, that is a different diagnosis and we cover it in why your website is not ranking on Google.
When a High Bounce Rate Is Fine
Plenty of pages should have high bounce rates, and chasing the number down on those pages is wasted effort.
- A contact page where someone finds the phone number and calls you. The visit ends. That is the page working perfectly.
- An hours or location page. They needed 1 fact and got it.
- A blog post answering a specific question, where the reader gets the answer and leaves satisfied.
- A single page site, where there is no second page to visit.
Note that under the GA4 definition most of these will not count as bounces anyway, because reading takes more than 10 seconds. Which is a good illustration of why the new definition is more honest than the old one.
When It Is Actually a Problem

A bounce rate is worth investigating when it is high on a page where the visit should have continued.
- A service page where the next step is a quote request
- A product or category page where people should be browsing
- A paid traffic landing page, where you are paying for every visit that leaves
- A page whose bounce rate jumped suddenly, which usually means something broke rather than something gradually declined
That last one is the most useful alert you can set. A sudden 15 point jump on a single page almost always means a technical fault, not a content problem.
How to Diagnose Yours in 20 Minutes

Skip the site-wide number entirely and do this instead.
- Build the Exploration described above, with landing page as the dimension.
- Sort by sessions, not by bounce rate. A page with 4 sessions and 100% bounce is noise.
- Look at your top 10 landing pages only. That is where the traffic and the money are.
- Split by device. If a page bounces at 40% on desktop and 75% on mobile, you have found a mobile problem, not a content problem.
- Split by channel. Paid social bounces higher than email or direct almost everywhere, because intent at the moment of the click is lower.
- Check the page loads in under 3 seconds on a phone. Speed is the single most common cause on the pages where it matters.
- Read the page as the searcher. Open the query in Google, click through, and ask whether the first screen answers what was asked. Mismatch between the search and the page is the second most common cause.
- Confirm your key events actually fire. Submit your own form and check the event appears in GA4. If it does not, your bounce rate is overstated.
Those 8 steps identify the cause on most sites. If the answer turns out to be that the site is too slow or too dated to fix page by page, that is a redesign conversation rather than an analytics one. If it is a specific page that is not converting, our guide to contact pages that convert and our notes on user experience cover the fixes.
Bounce Rate vs Exit Rate vs Engagement Rate

3 metrics that sound similar and answer different questions.
Bounce rate is the share of sessions that showed no engagement. It is measured in sessions and it is about first impressions on a landing page.
Exit rate is the share of views of a specific page that were the last page in the session, regardless of how many pages came before. It is about where people leave, not whether they engaged. A high exit rate on a thank you page is expected. A high exit rate midway through a checkout is not.
Engagement rate is simply 100 minus bounce rate. It is the metric GA4 shows by default, and it is the same information without the double negative.
The Short Version

Bounce rate is a diagnostic that tells you which pages to look at, not a score to optimise. Measure it per page and per device, ignore benchmarks published before 2023, and remember that the metric moved once already and the numbers before that move are not yours to compare against.
If the diagnosis points at your website rather than your analytics, that is what we do. See SEO services.
Frequently Asked Questions
What is a good bounce rate in GA4?
Around 36% puts you in the top quartile, and the cross-industry median sits at roughly 47%. Expect mobile to run about 12 points higher than desktop. Older benchmarks in the 26% to 70% range came from Universal Analytics and use a different definition, so they are not comparable to a GA4 number.
Is a 70% bounce rate bad?
It depends entirely on the page. On a service page where the next step is a quote request, 70% means something is wrong. On a contact page where visitors find a phone number and call, or a blog post that answers 1 specific question, it can be perfectly healthy. Judge it per page, never site-wide.
Why did my bounce rate change after moving to GA4?
Because the metric was redefined, not because your site changed. Universal Analytics counted any single-page visit as a bounce. GA4 counts a session as engaged if it lasts more than 10 seconds, fires a key event, or includes a second page view. A site reporting 62% under the old definition typically reports around 52% under GA4.
Does bounce rate affect SEO rankings?
Not directly. Google does not use Google Analytics data as a ranking signal. The confusion comes from the fact that slow pages and poor search intent match hurt both bounce rate and rankings, through separate mechanisms. Use bounce rate to find problems, not as a score to optimise.
Why is bounce rate hidden in GA4?
Google made engagement rate the default metric because it points the same information in a more useful direction, where a higher number is better. Bounce rate still exists as a non-standard column you can add to a report or an exploration, it is just no longer shown automatically.
Can I change the 10 second engagement threshold?
Yes, in Admin, Data Streams, Configure tag settings, Adjust session timeout. You can set it between 10 and 60 seconds per data stream. Raising it makes your bounce rate look worse but gives a stricter definition of engagement, which is useful on content-heavy sites. Change it once and leave it, since every change breaks comparability with your own history.